How TSI Flowmeter Support Operating Water-Network Intelligence with Flow, Pressure & Turbidity Insights
Turning water-network data into actionable intelligence with TSI Flowmeters, enabling proactive monitoring, efficient operations, and smarter decision-making.

Real-Time Monitoring for Smarter Water Utilities
In water utilities today, real-time monitoring means turning data into decisions. Utilities are using smart monitoring software to spot problems early, cut wastage, and boost efficiency.
At Impero IT Services, we worked with TSI Flowmeters Ltd to create a Bluetooth water-network app that gives technicians, supervisors, and decision-makers actionable flow-meter insights.
The Challenge: From Instrumentation to Intelligence
TSI Flowmeters Ltd designs world-class meters for measuring flow rate, volume, pressure, and turbidity in water systems. These instruments deliver exceptional precision, but hardware alone can’t provide the intelligence operators need for effective network management.
As water infrastructure becomes more complex, TSI’s clients were asking for a smarter digital layer, one that could:
Record and analyse readings session-wise
Provide mobile-based live monitoring.
Manage multi-user access and permissions.
Visualize trends across pressure, flow, and turbidity.
Link data to physical assets (hydrants, pipelines, pump stations)
TSI needed a digital solution that could complement their world-class hardware with modern, intuitive software capabilities. That’s where Impero IT Services came in.
Our Solution: Turning Sensor Data into Operational Insight
We built a custom water-network monitoring application that integrated flawlessly with TSI’s flow-meter hardware and brings powerful intelligence to the field.
1. Real-Time Data Visualization
Interactive charts and dashboards display how flow, pressure, and turbidity evolve over time. Users can instantly detect patterns such as:
A pressure drop indicating leaks or bursts.
A turbidity spike signalling contamination or pipe flushing.
A flow rate change suggests valve or blockage issues.
Sensor alerts for unusual patterns or malfunctions.
These insights turn reactive maintenance into predictive network management.
2. Asset Management Integration
The system links every data point to a specific asset, be it a hydrant, pipeline segment, or monitoring station. Users can:
Create and edit asset records.
Attach sessions and readings to each asset.
View performance trends and maintenance history per location.
Generate reports and insights for each asset over time.
This helps utilities build a digital twin of their network, mapping not only where issues occur but also how they evolve.
3. Organization-Wide Dashboard
A central dashboard gives management teams a unified overview of all assets, sessions, and user activity. It highlights:
Assets requiring attention
Anomalies detected by field sensors
Aggregated performance metrics
Historical trends and comparisons for better planning
Executives can therefore monitor, prioritise, and plan maintenance efforts with data-driven precision.
4. Session-Based Logging
Every measurement is captured as part of a session, enabling users to track readings over time. Sessions store flow rate, pressure, and turbidity data, all time-stamped and traceable.
This structured data model allows operators to compare performance historically and identify subtle changes in network behavior.
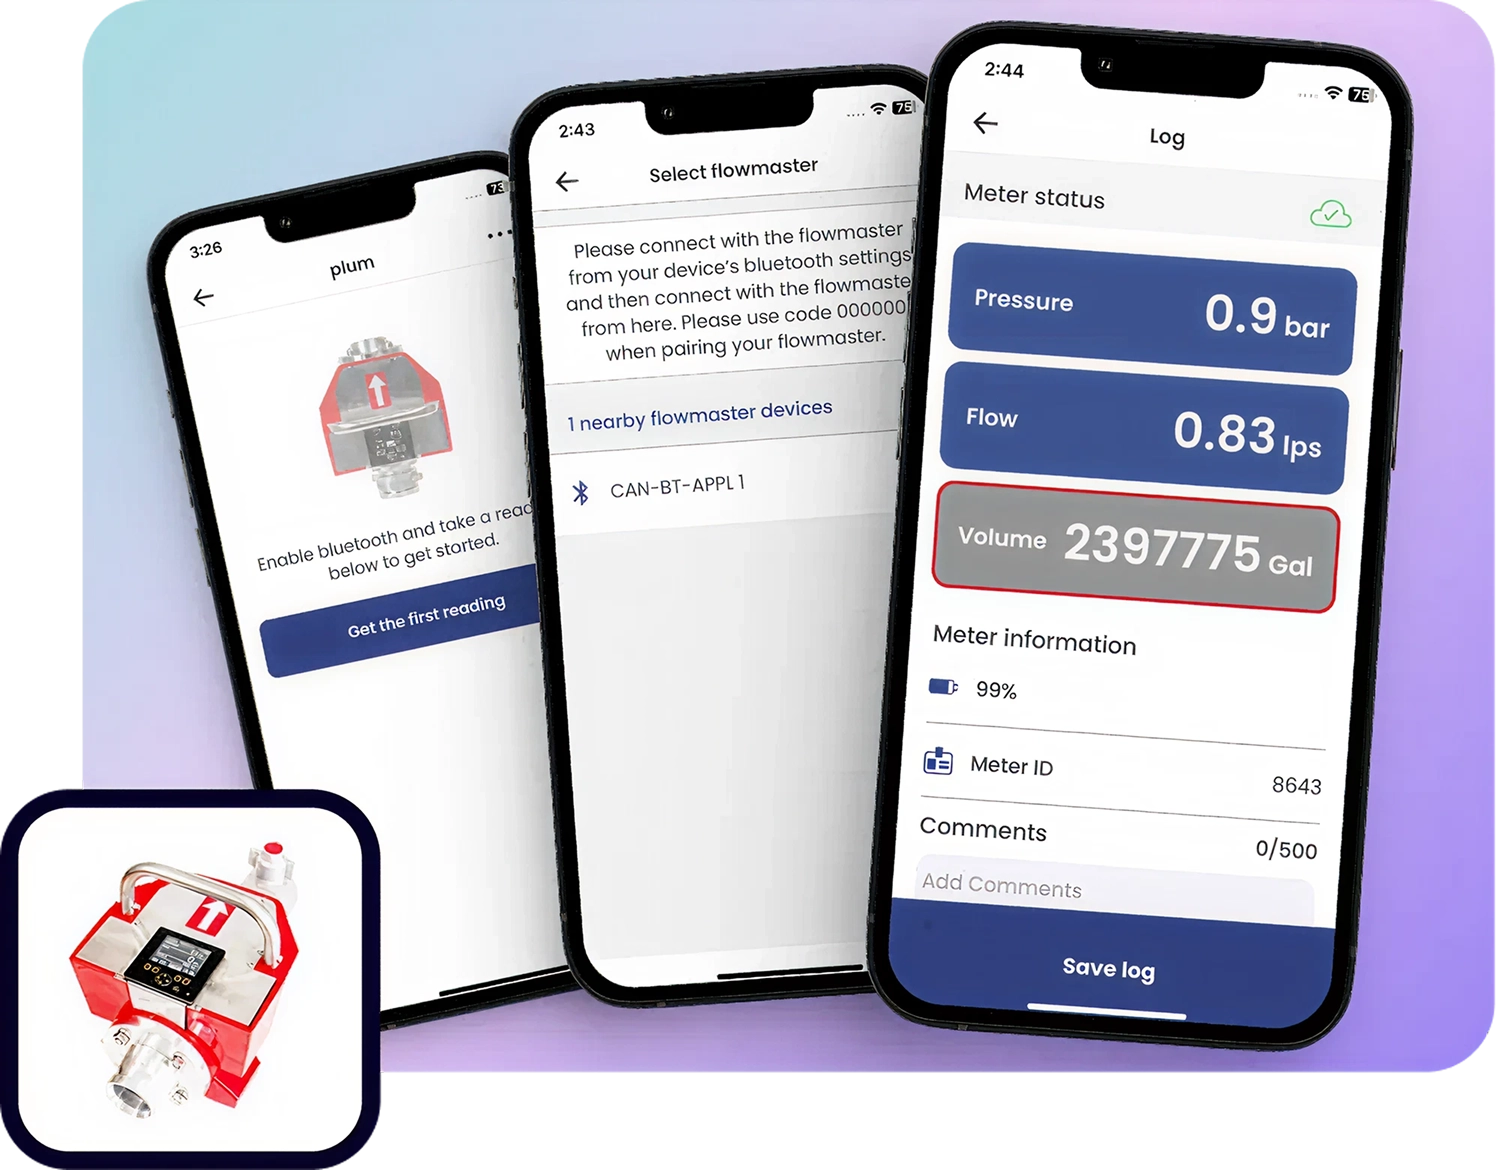
5. Bluetooth-Powered Connectivity
Our app connects directly to TSI flow meters via Bluetooth, allowing real-time data streaming to smartphones and tablets. This feature empowers field engineers to view live readings.
They can instantly see variations in flow rate, pressure, and turbidity, helping diagnose issues on the spot and reducing response time.
Key Benefits of the Solution for Measurable Impact
By combining real-time data capture with intelligent visualization and asset context, the solution transforms flow, pressure, and turbidity readings into actionable insights that drive faster decisions, proactive maintenance, and smarter water-network operations.
Actionable, Context-Rich Data
Linking measurements with sessions, assets, and timestamps transforms raw readings into contextual intelligence. It enables users to understand what happened, where, and why.
Early Anomaly Detection
The combined visualization of flow, pressure, and turbidity helps identify subtle trends. Small turbidity drops can signal early leaks enabling preventive maintenance before issues escalate.
Real-Time, Mobile-First Monitoring
Bluetooth connectivity gives technicians instant insights directly in the field, enabling them to view live readings on mobile devices while eliminating manual logging.
Multi-Role Access and Collaboration
Each team sees what’s relevant to their role. Technicians create sessions and log data, supervisors monitors performance, and executives access dashboards and trends for insights.
Full Network Visibility
With the company-wide dashboard, management can quickly identify which assets show irregularities or need servicing, optimising resource allocation and ensuring efficient water-network operation.
Supporting TSI’s Sustainability Mission
Our software supports TSI’s mission of sustainable water-network management by turning instrumentation data into actionable insights that reduce losses and improve quality.
Engineering Intelligence: From Hardware Data to Scalable Software
Our mobile app development approach blends deep domain understanding, robust architecture, and smooth hardware integration to deliver a reliable, scalable platform tailored to real-world water-network workflows and operational demands.
From Data to Decision-Making
By combining TSI’s advanced instrumentation with Impero IT Services’ expertise in IoT and software engineering, we created a solution that bridges the gap between field measurement and operational intelligence.
This project demonstrates how Bluetooth technology in water utilities can revolutionize the way organisations manage their networks, reducing waste, improving quality, and making infrastructure smarter.
Final Thoughts
Impero IT Services acted as the strategic technology partner, transforming TSI Flowmeters’ precision hardware into an intelligent, enterprise-ready digital platform. By aligning software architecture with real-world water network operations, we enabled real-time insights, accurate data capture, and organization-wide visibility.
We as a leading mobile app development company in New York ensured a scalable solution that delivers immediate operational value while remaining future-ready.
If your organization is looking to build custom water-network monitoring software, connect IoT sensors with mobile dashboards, or digitalize your utility operations, Impero IT Services is here to help.
💧Let’s turn your instrumentation data into actionable intelligence. Contact us to start your digital transformation journey today.

Author
Faiz Syed
Faiz Syed is an ISTQB® Certified Test Engineer and Project Coordinator with hands-on experience in quality assurance across IT projects. He specializes in software testing, test case design, and quality processes, ensuring reliable and high-performing deliverables. Known for his collaborative and responsive approach, Faiz works closely with cross-functional teams to support smooth project execution.
Begin Your Next Phase of Digital Growth
Collaborate with a technology partner that understands your business goals and delivers solutions built for scale, security, and long-term success.
Schedule a Consultation